
Markets are in a constant battle between emotions and numbers, between quants and discretionary traders, active and passive money managers, and ultimately sentiment and valuation.
It’s the ebb and flow between these factors that drives price change, sector rotation, index under and outperformance.
This is never more apparent than in the midst of a geopolitical/macro crisis, which is where we are right now.
We keep saying it, but the markets hate uncertainty, surprises and inconsistency. Because it's very hard, if not impossible, to model and price these things out into the future. Which, of course, is what the markets are all about.
This is one reason why people are always looking back in time for comparisons to current events.
In fact, we are going to start by doing just that, that is, searching for some context.
Deutsche Bank has kindly looked at the performance of the S&P 500 during a geopolitical crisis and put the results of their screen into the chart below.
The current index performance is the black line, and the historic median or mid-point performance of the index in a crisis is the solid green line.
Whilst the dashed green line is the 25th and 75th percentile, which, between them, create an upper and lower boundary or range.
As we can see below, the current S&P move has broken below that lower boundary (25th percentile)
Deutsche Bank had this to say about that move:
“ At current levels, the S&P 500 has fallen a little more than the average historical response to geopolitical shocks, i.e., down -6% to -8% in about 3 weeks.”
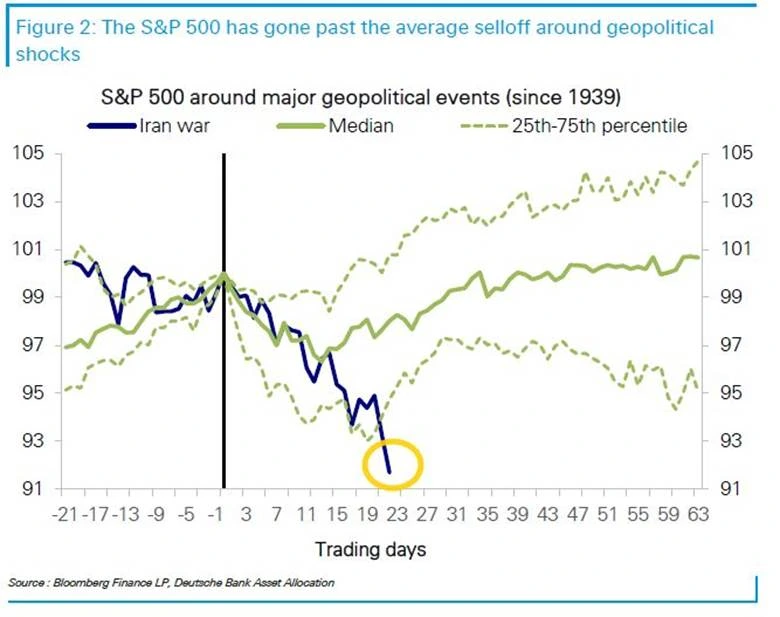
Source: Deutsche Bank Research
The S&P 500 has fallen further and faster than we might have anticipated, but it's decent is not yet irrevocable. That could change, however, the longer the conflict drags on, or if it turns into a ground war.
The leaders are in the bunker.
That’s no doubt where Iran’s leadership is at the moment.
But Nasdaq /Technology stocks (which for so long provided leadership to the stock market) are also in a hole.
As we can see in this chart, which shows Nasdaq's performance relative to gold, over the last 6 years.
A period which itself was full of geopolitical surprises.
The upshot is that Nasdaq is back at levels (in these terms) that we haven't seen since the pandemic.
Though in absolute terms, the Nasdaq 100 is down just under -8.0% in 2026, it's also true that less than 41.0% of stocks in the index are trading above their 200-day MA at the time of writing.
It's often said that adversity creates opportunity, and that’s very true in the markets; however, we're also cautioned to never try to catch a falling knife.
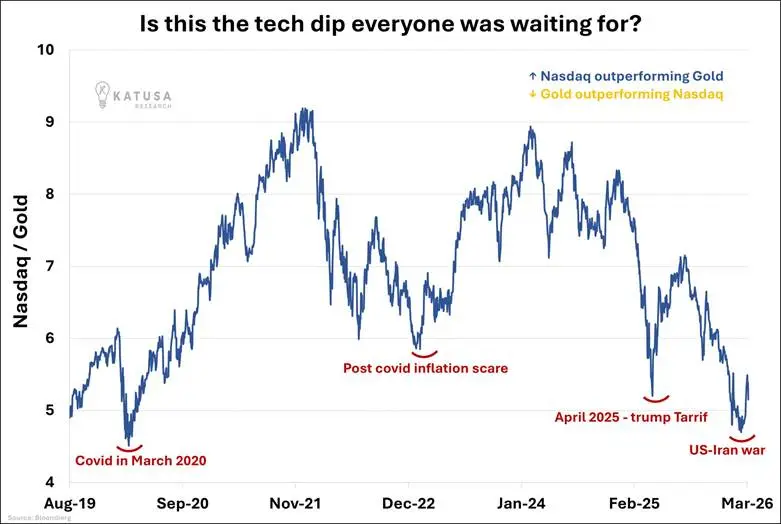
Source:Charles-Henry-Monchau/Katsua Research
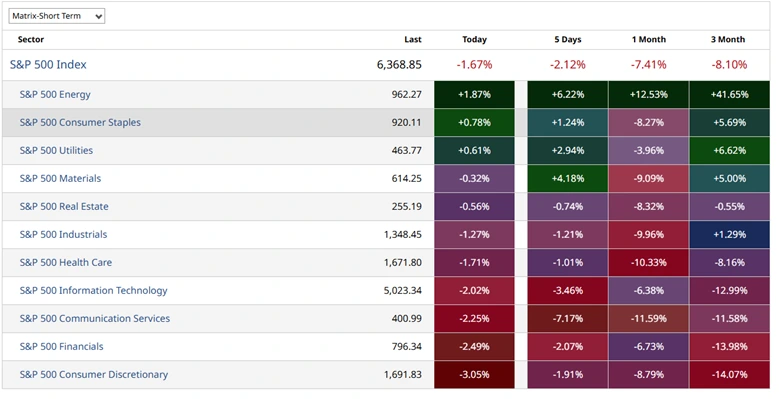
Deep in the red
You can get a feel for sentiment/positioning by looking at this heatmap, which shows the percentage of stocks in the S&P 500 and its component sectors that are trading above key moving averages.
Even if you have never seen this table before, you should quickly be able to grasp the situation.
For example, most values in the table are below 50.00%. (All the values for the S&P are sub 50.00%)
The only sectors that deviate from that are defensive Utilities and Energy stocks, which, of course, are being driven higher by the fallout from the war.
Coming back to Technology, just 23.0% of stocks in the sector are currently above their 50-day MA, which means that almost 80.00% (4 out of 5) of the stocks in it are trading below that key benchmark.
To put that in simple terms, the vast majority of the stocks within the S&P 500 technology sector are priced below their 50-day rolling average price.
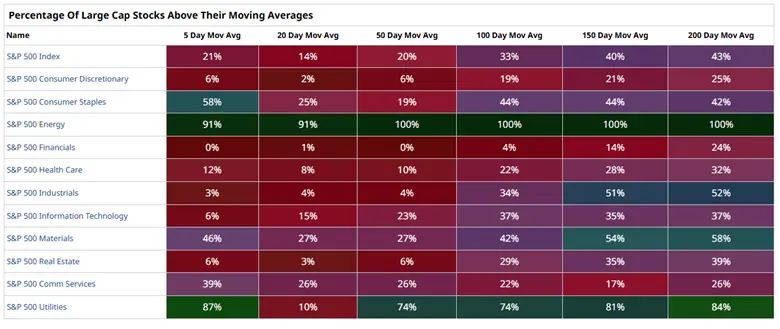
Source: Barchart.com
How can this be right?
It’s not just Technology stocks that have come under pressure.
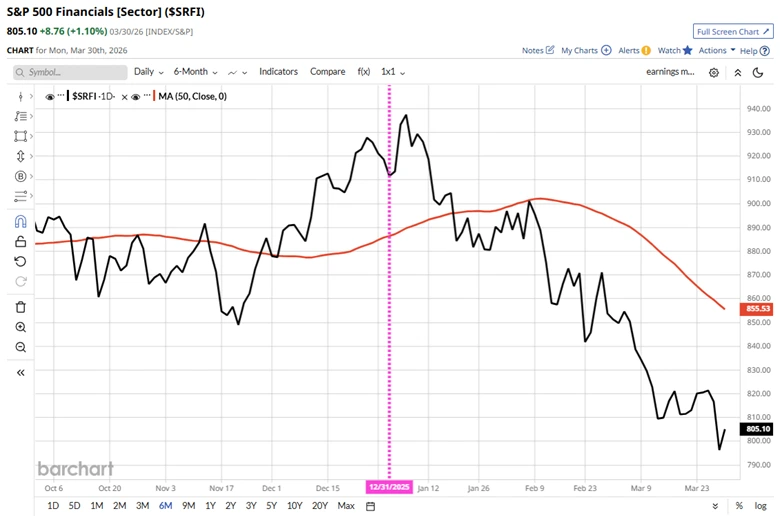
Take a look at the charts below, which are snapshots of the MA% levels in the S&P Financials sector.
To me, this is saying that the sector is friendless, with hardly any stocks in the group trading above their 100-day MA, and less than 1 in 4 stocks is trading above their 200-day average.
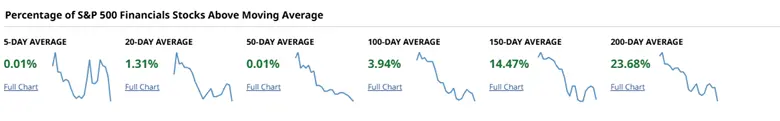
Source: Barchart.com
S&P 500 Financials performance in 2026 is shown to the right of the pink dashed vertical line.
What a difference a month makes ..........
The war has turned the market on its head. The rotation that started in September, which saw traders and investors coming out of tech to buy old economy stocks with tangible assets and businesses, has been derailed.
Materials (which had been a big winner) fell by more than -9.00% in a month; in fact, Energy is the only sector to have posted a one-month gain.
Source: Barchart.com
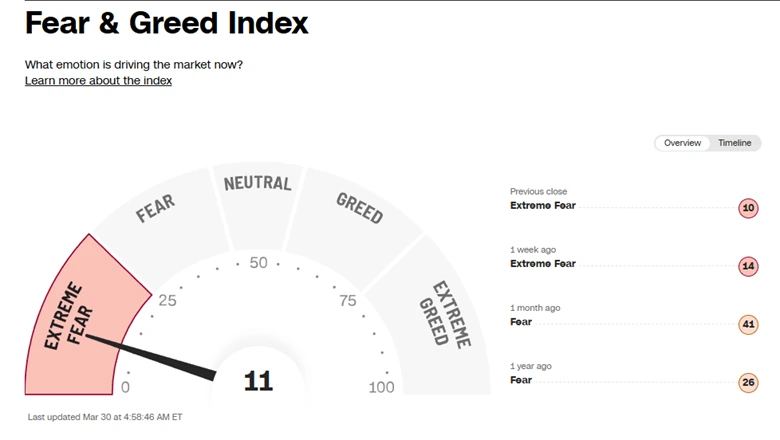
So much for sentiment, which, if not at rock bottom, is getting close to it.
Not helped by predictions of recession, the return of higher prices and the possibility of Stagflation.
The CNN Fear and Greed Index, see below, shows that traders are pretty bearish. With the indicator firmly in the middle of extreme fear. It can move lower still.
The lower it goes, however, the more tempting it becomes to treat it as a reverse indicator or buy signal.
They say, “Fools rush where angels fear to tread”. So, as ever, let's wait for the price action to tell us that there is a trend change in the offing rather than jumping blindly in.
Source: CNN
How about the other side of the coin? What is that telling us about the market?
Well, we will look at valuation in the second part of this short series of articles, so stay tuned.
The information provided does not constitute investment research. The material has not been prepared in accordance with the legal requirements designed to promote the independence of investment research and as such is to be considered to be a marketing communication.
All information has been prepared by ActivTrades (“AT”). The information does not contain a record of AT’s prices, or an offer of or solicitation for a transaction in any financial instrument. No representation or warranty is given as to the accuracy or completeness of this information.
Any material provided does not have regard to the specific investment objective and financial situation of any person who may receive it. Past performance is not a reliable indicator of future performance. AT provides an execution-only service. Consequently, any person acting on the information provided does so at their own risk. Forecasts are not guarantees. Rates may change. Political risk is unpredictable. Central bank actions may vary. Platforms’ tools do not guarantee success.