
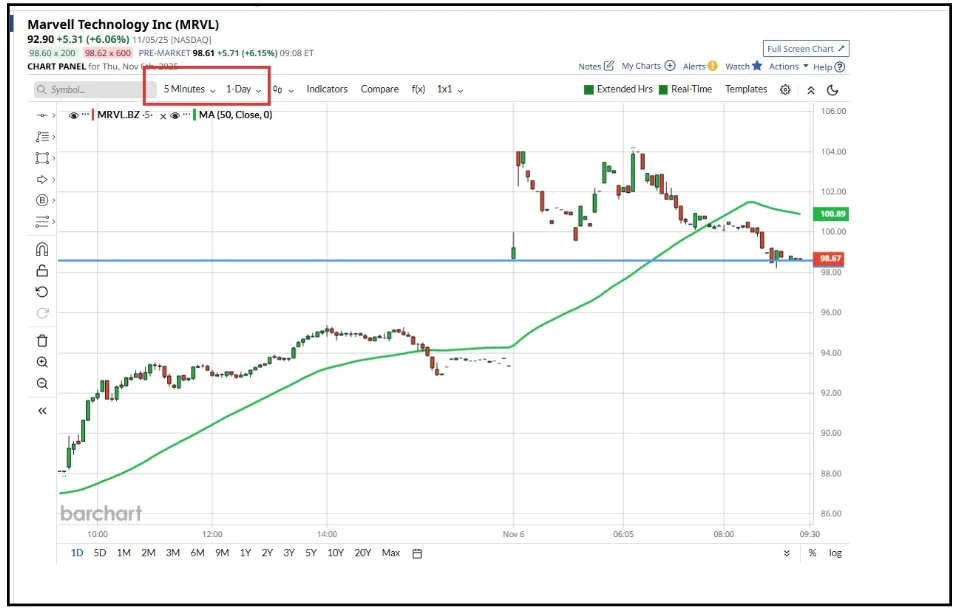
I shared the chart below, of chip maker Marvell Technologies MRVL US, with a member of my Idea Factory chat group, just ahead of the US open on 6th November.
He was looking for opening range breakouts, and Marvell had traded higher by more than +6.0% pre-market, and had put on +6.06% in the prior session.
So it seemed reasonable to assume that it could move higher again.
The stock had printed at a high of $104.00 in the pre-market and had subsequently come back to trade at what looked like gap support, circa $98.67
The keyword in those opening sentences is could
The original idea was wrong. That's not the end of the story; in fact, it was the start of a new one, only this time on the downside.
Now it’s never easy to admit you were wrong, harder still to trade against your original idea, it just feels wrong.
However, this is an example of where my mantra of being pragmatic and not dogmatic comes into play.
Trading is about being consistently profitable rather than consistently right.
So tough as it is to do, you need to put your ego to one side and react to what the market is telling you.
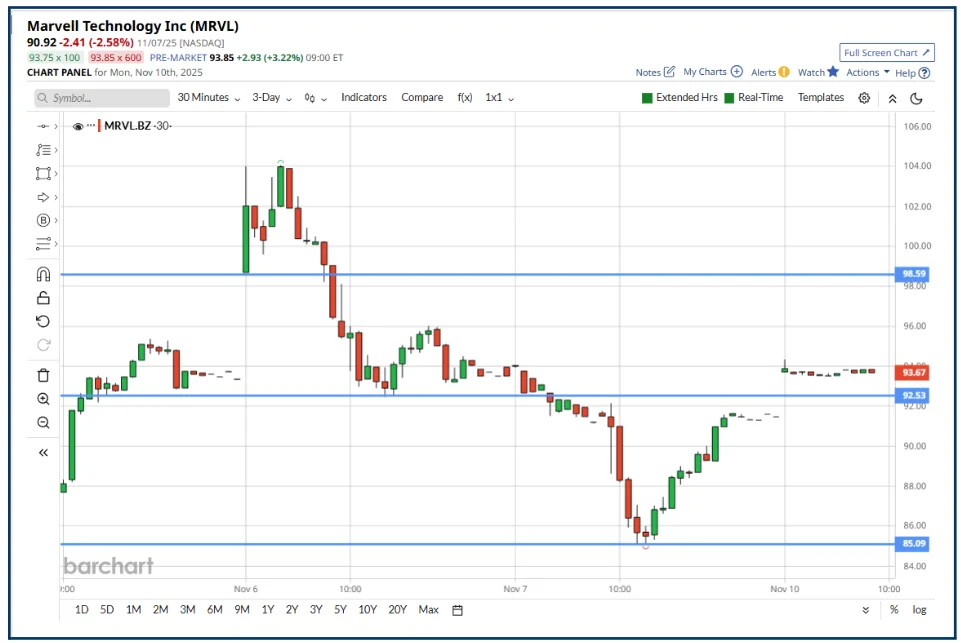
Marvell failed to take off, despite having tested to $104.00; it rejected any further move higher and rapidly sold off to the gap support at $98.59.
Which turned out not to be any kind of meaningful support at all.
From there, the price moved down to $92.53, a support level from the previous day.
As we can see, that level gave way the following day as well.
And Marvell traded down to $85.09, marking the best part of a $20.00 range, over just a few sessions.
The takeaway here is that if your initial idea is wrong, there may well be an opportunity to trade the stock in the opposite direction. If you see signals in the price action that are leaning that way.
But here’s the thing, we shouldn’t just reference the price action in the current session, in isolation;
Rather, the idea is to use that, together with signals from the previous session or sessions.
Particularly high and low points, support and resistance levels, and more so, if we see repetition in the price action at those price points.
It's not just over short-term time frames that the market sends out signals
Here is a textbook example on the 6-month chart of Italian oil major Eni Spa ENI IM.
Let's join the story in late June:
A red arrow on the left of the chart highlights a bullish green candle and a moving average crossover.
The stock subsequently gaps higher, but then consolidates/moves sideways, highlighted by the blue arrow.
Price action that indicates an area of support, and seemingly, a lack of committed sellers in the stock at this level. Or perhaps there was just one seller, who was active at the top of the consolidation range.
Once the seller(s) were out of the way, the price moved higher again.
However, on this occasion, it was the bulls or buyers that were unconvincing, and the Eni price moved sideways in a relatively narrow range.
This period of consolidation went on for far longer than the initial period, and in doing so, it established a clear area of support around €14.46.
The sideways move continued until late October, in fact, when we saw a second bullish MA crossover, again highlighted by a red arrow.
This was followed by a moderately bullish candle and a subsequent gap higher.
This was the catalyst for a breakout of the price range, and the stock followed the path of least resistance and moved into new territory.
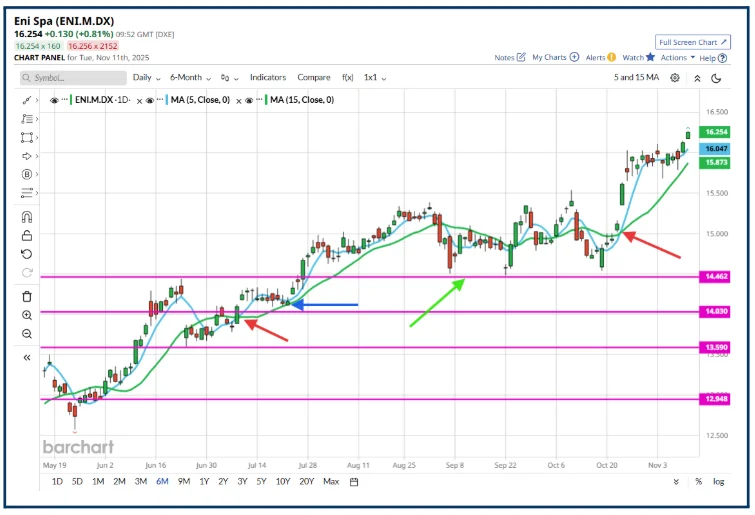
There was a +7.0% move higher between the low point of the gapping candle and the most recent high, and almost +13.0% from the low of the preceding candle. Of course, the move may not be finished yet.
None of these signals, before the late October gap higher, was individually strong enough to be called a buy signal in its own right.
However, when they are put together like the pieces of a jigsaw puzzle, they provide us with an impression of what was to come.
Being able to read signals in the market like this won't happen overnight, but as you become more familiar with and more comfortable at reading and interpreting candle charts or other forms of technical analysis, this should start to become easier to do.
The information provided does not constitute investment research. The material has not been prepared in accordance with the legal requirements designed to promote the independence of investment research and as such is to be considered to be a marketing communication.
All information has been prepared by ActivTrades (“AT”). The information does not contain a record of AT’s prices, or an offer of or solicitation for a transaction in any financial instrument. No representation or warranty is given as to the accuracy or completeness of this information.
Any material provided does not have regard to the specific investment objective and financial situation of any person who may receive it. Past performance is not a reliable indicator of future performance. AT provides an execution-only service. Consequently, any person acting on the information provided does so at their own risk. Forecasts are not guarantees. Rates may change. Political risk is unpredictable. Central bank actions may vary. Platforms’ tools do not guarantee success.