
Trading is easy; it's just a question of following the rules and not deviating from your plan, no matter what happens.
However, as Prussian General, Helmuth Von Moltke famously said :
"No plan survives contact with the enemy"
And so inevitably, traders have to adapt their plans to the market conditions they find themselves in.
As we noted in the first article in this short series, risk and money management rules are akin to safety barriers on a fast, multi-lane road; you can't or shouldn't try to change or challenge the barriers.
However, you can adjust your driving to suit the conditions, by, for example, slowing down, leaving bigger gaps between you and other vehicles, or turning on your lights and windscreen wipers to improve visibility .
Being adaptable, thinking on your feet, and thinking logically, are cornerstones of trading success.
This can be made easier by leveraging the experiences of those who have gone before us.
We can learn from their lessons and, where possible, avoid making the same mistakes, and in turn create more positive outcomes for ourselves, and our trading PnL.
With that in mind, here are some more of Bob Farrell's observations/rules on trading and the markets.
We can use these nuggets of experience to size up the environment, we find ourselves in and adjust our plan as necessary.
Fast moves don’t end gently - Parabolic rises collapse hard.
“A parabolic chart pattern signifies a price movement with a curve resembling a parabola, indicating a period of rapid, unsustainable price acceleration that's often followed by a sharp reversal”
Prices change are based on two things: new information, and or a change, in the dynamics of supply and demand (sentiment).
Remember that the Bid Ask spread, or two way price in a stock, is a measure of the balance between supply and demand.
When price stays within a known and narrow range, then supply and demand are loosely in balance.
Support and resistance lines on the chart reflect the points at which buyer and sellers can be found.
However when the supply and demand balance in a stock shifts, then, so will its price
For example in the chart of Western Digital WDC US, below, demand for the stock starts to outstrip supply from April onwards and the price rises to reflect that.
There is a brief return to equilibrium in August. Before buyers emerged once more.
With the price line on the chart almost going vertical (parabolic), as the price is driven to higher and higher levels to try and tempt the sellers (supply) back into the market.
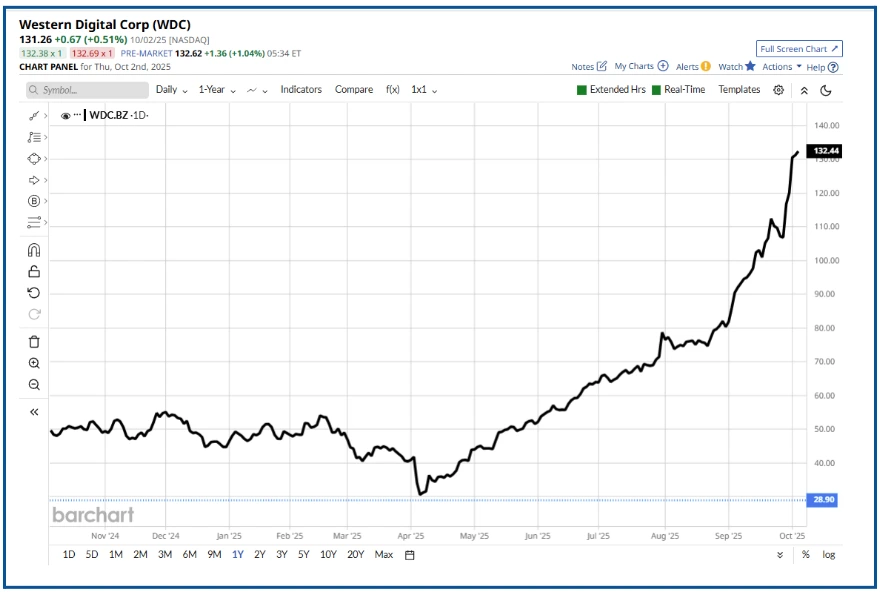
Source: Barchart.com
The steepness in the rise of the price line is a measure of the mismatch between buyers and sellers. T
The same is true in reverse of course and when supply is dominant prices fall, as the market resets, trying to find a new level, at which two way business can be transacted.
We can see that cycle play out in this chart of Cisco Systems CSCO US, during the the dot com boom and bust.
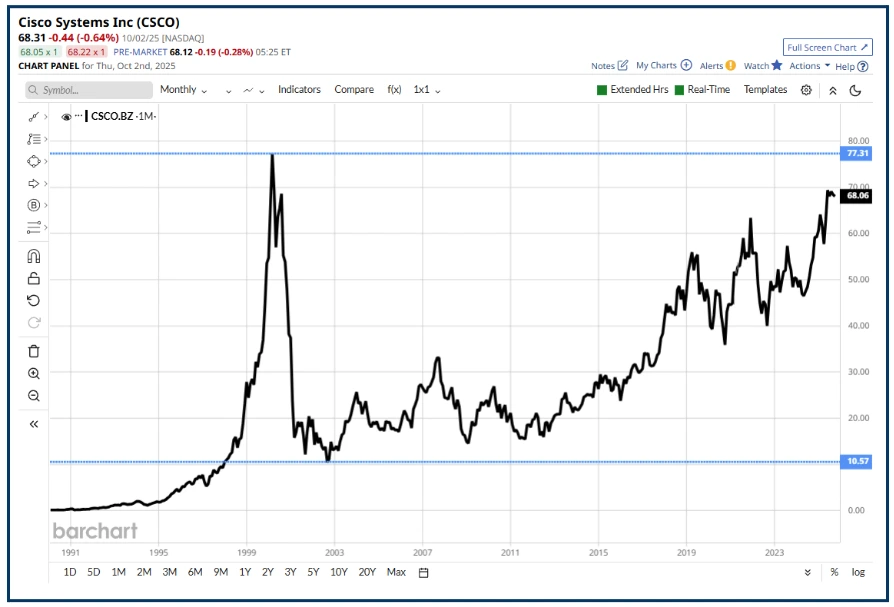
Source: Barchart.com
Other clues
Changes in the balance between supply and demand show themselves in other data as well.
For example here is a table of S&P 500 stocks which have had a high level of new one month highs.
WDC US is at the top of the table and is also the biggest 1-month gainer.
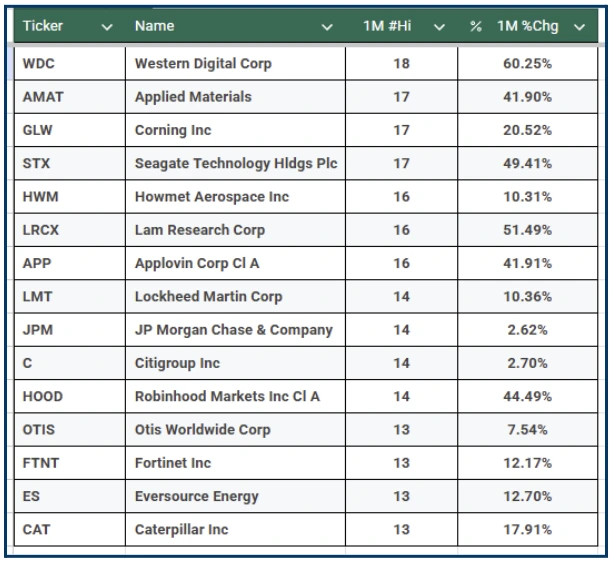
Source: Barchart.com/Darren Sinden
The public buys tops and sells bottoms, crowds chase comfort, not value
I think over time, and with the help of investor education and a better understanding of the markets things have improved since Bob Farrell put pen to paper.
However there is still a tendency to mistime the market, among many retail investors. And that can often result in buying at the top or selling at the bottom.
In each case you don't want to be the last one to the party. Technical analysis can help with this, and allow us to spot trend changes and reversals.
For example we can use the number of new highs and lows over a gvien period, as a barometer of trend strength, alongside indicators such as RSI 14.
We can also look at a stocks chart and performance over multiple time frames to get a sense of the bigger picture.
Such as here in Spanish solar energy stock Solaria Energia which is charted over 1-year, 3-months, 1-month and 5-day periods, below
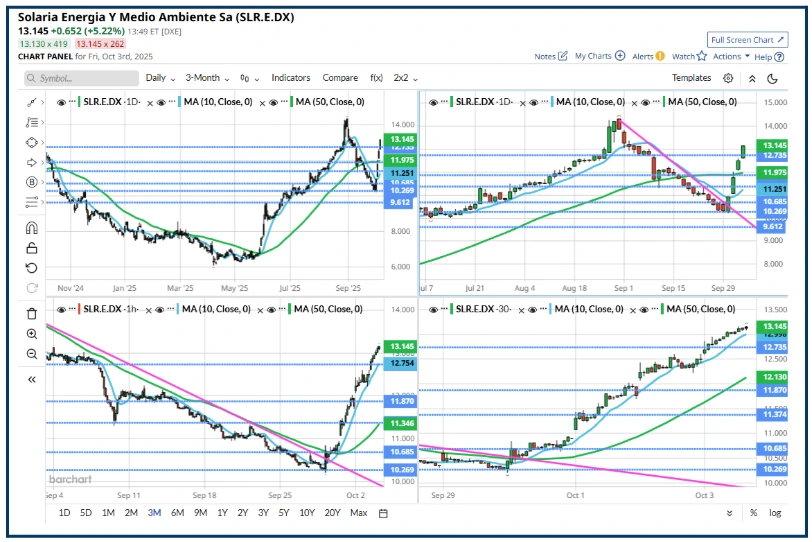
Source: Barchart.com
Whether you are buying or selling, ideally you want to be an early entrant into a trade and not over stay your welcome. Although if you can move your stop loss beyond your entry point trade management becomes that bit easier.
When Bob Farrell talks about buying comfort, he means following and acting with the crowd, adopting a safety in numbers approach.
When he talks about value, he also means opportunity, a situation that the market has cottoned onto just yet, but which offers value to a trader who has pre-empted the market.
Here is the Solaria Energia chart from a few days before, when I first got interested in them.
They had recently bottomed and had started to pick up, breaking above the 10 D MA line as they did so.
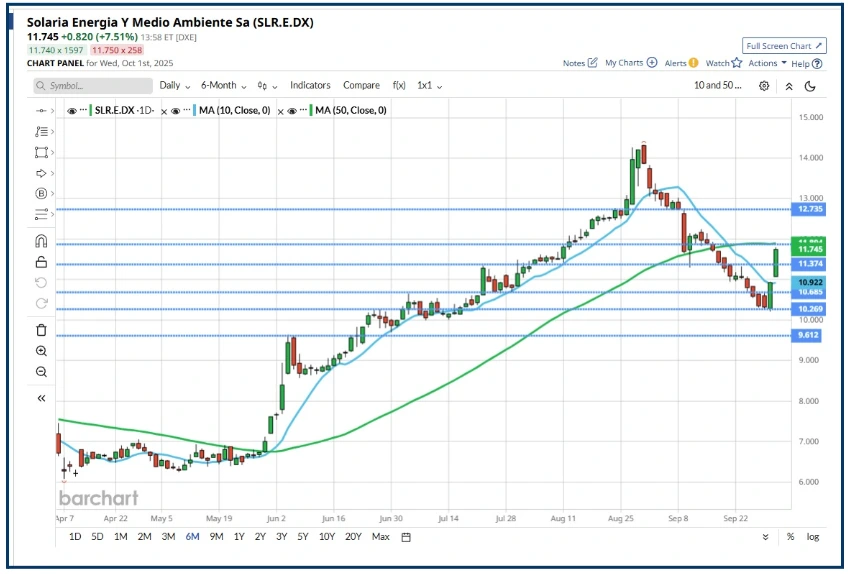
Source: Barchart.com
In fact they rallied by more than +26.0% over the last week making gains on 4 out 5 days, which as you can see below was very different to what had gone before.
Solaria Energia High, Low, Close, Open data
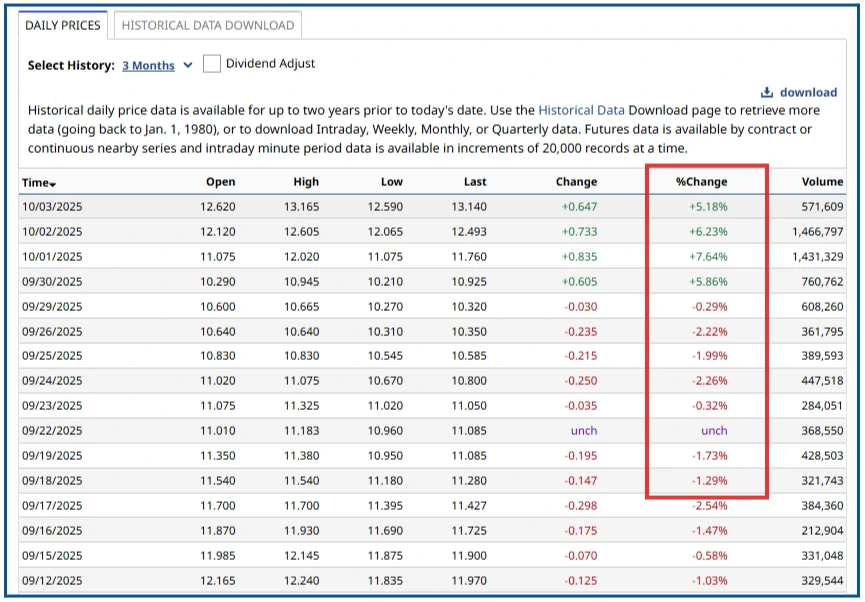
Source: Barchart.com
In the third and final part of this series, we will look the last five of Bob Farrell’s trading rules, many of which are highly topical and have direct relevance to the current market.
The information provided does not constitute investment research. The material has not been prepared in accordance with the legal requirements designed to promote the independence of investment research and as such is to be considered to be a marketing communication.
All information has been prepared by ActivTrades (“AT”). The information does not contain a record of AT’s prices, or an offer of or solicitation for a transaction in any financial instrument. No representation or warranty is given as to the accuracy or completeness of this information.
Any material provided does not have regard to the specific investment objective and financial situation of any person who may receive it. Past performance is not a reliable indicator of future performance. AT provides an execution-only service. Consequently, any person acting on the information provided does so at their own risk. Forecasts are not guarantees. Rates may change. Political risk is unpredictable. Central bank actions may vary. Platforms’ tools do not guarantee success.