
Regular readers will know that I like charts. I look at them every day and use them in every article or piece of analysis I write.
So what do charts offer that makes them integral to my workflow and idea generation?
It’s often said that a picture speaks a thousand words, and there is plenty of truth in that statement.
Humans respond to visualisations, our brains are hardwired for visual processing, with roughly 20% of it dedicated to vision, and another large portion is focused on image processing.
Visualisation acts as a bridge between data and understanding, engaging both the brain’s cognitive and emotional centres, which means that when we take in information visually, it's far more likely to evoke a response than text alone.
Charts of the financial markets and economic data are a specialist area of course, but the principles are the same.
When I look at a chart, it can spark my imagination and get me thinking about what could happen from here.
For example, this is a chart of Finnish telecoms equipment maker Nokia, in this case its the firm's US-listed ADRs.
I have drawn a 20-year chart in the top window, and a two-year plot in the lower window.
Immediately, we can see that Nokia has been trading higher recently and is testing through resistance.
And by looking at the long-term (upper) chart, we can see that the resistance level is just one of many, and that there is plenty of headroom for Nokia’s stock price above its current level.
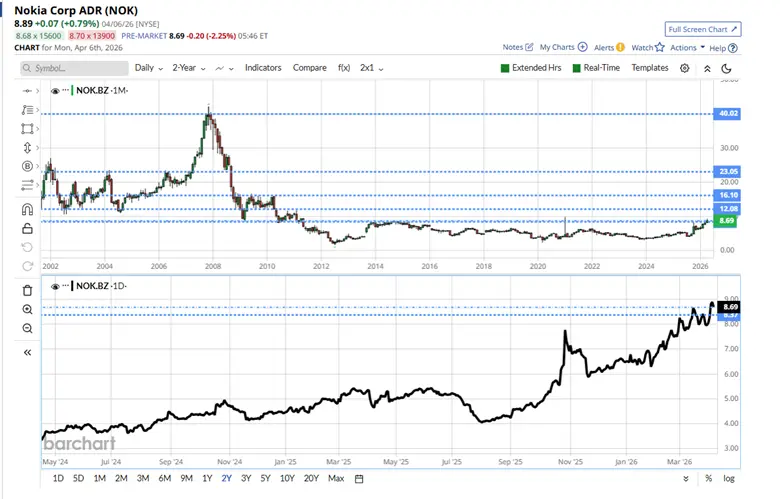
Source: Barchart.com
Why does that interest me?
Well, because Nokia is undergoing a transition (something it's no stranger to, having started life as a wood pulp mill in 1865), this time it's looking to AI to upgrade and manage an intelligent 6G phone network.
This is seen as an essential component for the next generation of AI tools and connectivity.
Will Nokia be able to make that transition? I don't know for sure.
However, Nokia charts can show us what the rest of the market thinks about that possibility, or at least the possibility of a significant price rise from here.
What information do charts contain, and what can they tell us?
Charts take many forms; however, when we are talking about price charts in the financial markets, they are nearly always drawn to visualise the price action and market structure.
The price action is made up of a combination of price and volume, supply and demand, and the level of greed and fear among investors and traders.
In effect, a price chart tells us about the psychology of the traders who are active in the instrument under observation.
It can tell us about where they like to own or buy a stock, where they like to sell, or short a stock.
The levels of daily activity in the stock, daily ranges, volumes, etc.
A chart can identify points of support and resistance, which can be considered as the areas, or price levels, around which buyers and sellers like to congregate.
Charts can tell us which of the two groups has the upper hand in an instrument over a given period of time. And, charts allow us to identify trends and repetitive patterns within the price action.
We can annotate charts with indicators to reveal even more about the price action, by, for example, adding moving averages, Bollinger bands or Fibonacci retracements.
Technical analysts believe that a stock's adherence to Fibonacci levels reflects the subconscious actions of traders in that stock.
Humans find the proportions of the golden ratio (to which Fibonacci numbers are linked) attractive, and therefore, traders are said to subconsciously seek those numbers out in the price action.
Charts can show where a call to action in a stock can be found, inform us about trade entry and exit prices, stop loss placement and much more.
Here’s an example of the information a chart can convey
This is a 6-month chart of US health insurer Humana HUM US, drawn pre-market on 07-04-2026
We can see that the price gapped higher in the pre-market, and at the time the chart was drawn, it was up by almost +10.0%.
In gapping higher, the price moved above the 50-Day moving average green, and resistance just below $198.00, all of which looks and sounds bullish.
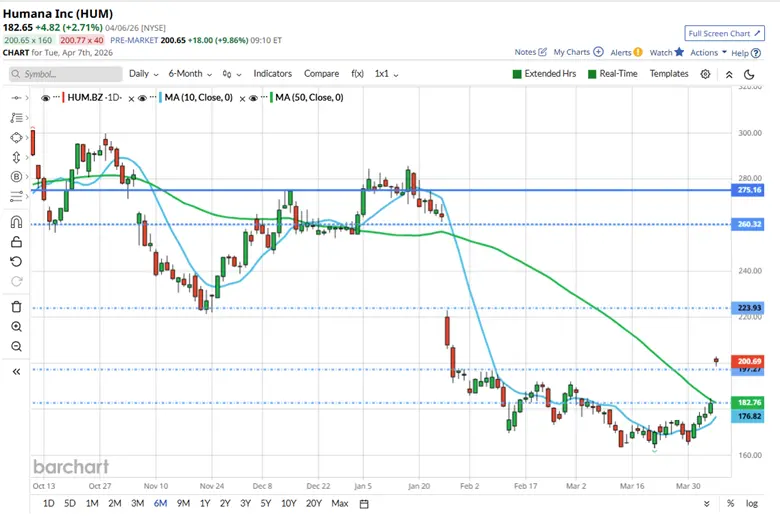
Source: Barchart.com
However, by looking at shorter-term charts, in this case, a 1-day, 5-minute candle chart of Humana.
We can see that the initial euphoria cooled in the pre-market, and that the price drifted lower, and away from the high of the day.
The stock continued to make lower lows after the open, suggesting that, on reflection, the market was not as impressed as the initial move higher suggested.
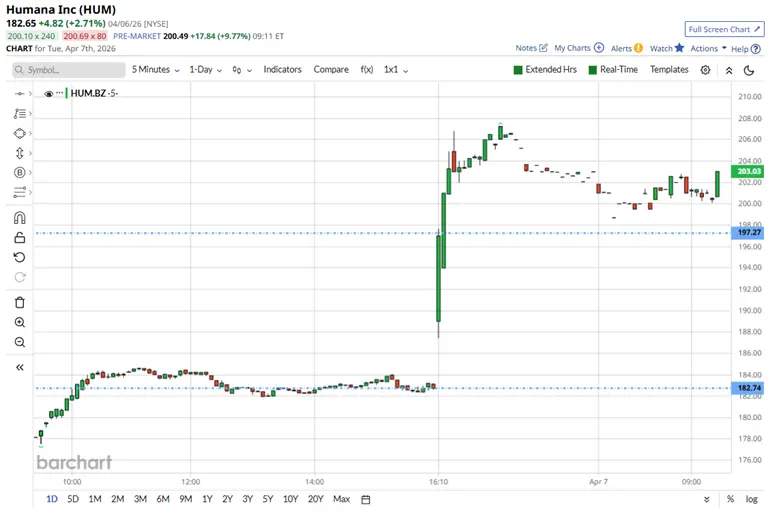
Source: Barchart.com
By just after 3.00 pm London time, Humana was only up by +4.50%.
Charts can make you money, too, if you know how to read them
That’s because they can create an easy-to-follow picture about what's coming next.
The chart below is a 14-month weekly chart of memory chip maker Sandisk SNDK US, which was spun out of Western Digital WDC US, in February 2025.
..
The pink ellipses on the chart highlight the points at which the price of Sandisk broke above a prior high.
New highs, of course, are one of the signs to look for when you're trying to establish whether an uptrend is in place.
A series of higher highs, posted after a prior high has been taken out, can go a long way to confirming upside momentum. Which, in this case, generated an 18-fold increase in the Sandisk share price.
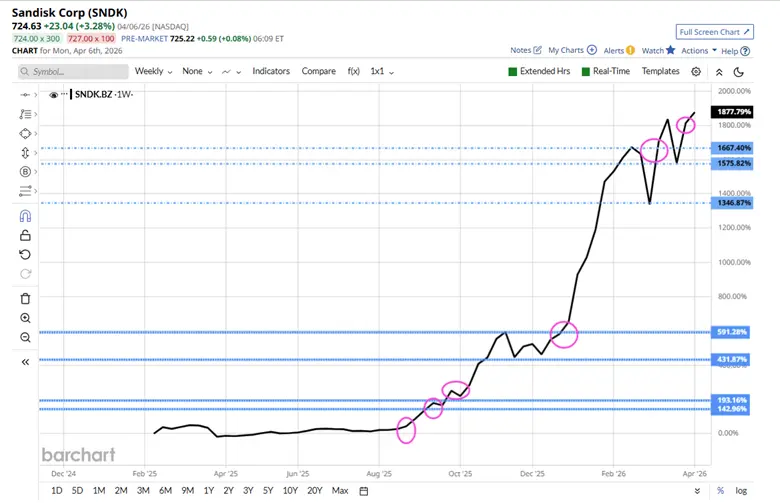
Source: Barchart.com
When traders talk about a “multi-bagger” position, this is exactly the kind of thing they have in mind.
Of course, we will be looking at more charts and the information they contain in the near future.
The information provided does not constitute investment research. The material has not been prepared in accordance with the legal requirements designed to promote the independence of investment research and as such is to be considered to be a marketing communication.
All information has been prepared by ActivTrades (“AT”). The information does not contain a record of AT’s prices, or an offer of or solicitation for a transaction in any financial instrument. No representation or warranty is given as to the accuracy or completeness of this information.
Any material provided does not have regard to the specific investment objective and financial situation of any person who may receive it. Past performance is not a reliable indicator of future performance. AT provides an execution-only service. Consequently, any person acting on the information provided does so at their own risk. Forecasts are not guarantees. Rates may change. Political risk is unpredictable. Central bank actions may vary. Platforms’ tools do not guarantee success.