
In the previous article, we looked at areas of the market away from technology stocks. Which have been the dominant driver of returns in US equities over the last three months?
This was on the basis that the forthcoming IPOs from SpaceX and then Anthropic have the potential to drive the market higher, but also to call a top on what has been a remarkable run.
In the first article, we let AI do the heavy lifting and asked two separate chatbots for their picks from a list of underperforming S&P 500 stocks, which I have put into a watch list so that we can monitor their performance over the coming weeks and months.
In this article, I thought we could explore some other areas of the market and methods of looking for opportunities. I started my research with the Russell 1000 index, which contains the S&P 500 names and the next 500 biggest US stocks on top.
I calculated the average values for the Russell 1000 stocks over a series of fundamental data points that you can see below. The average values are displayed in the top row of the table.
I then filtered each column referencing the average value, so, for example, in the case of P/E fwd (the forward price earnings ratio), I wanted to find values below 27.92 and did the same with Price to Sales and Price to Book. However, when it came to 5-year dividend revenue and earnings growth, I wanted to find values in excess of the index average.

Source: Darren Sinden
What I am looking for here are stocks trading at a lower than average PE multiple that are growing at a rate that’s greater than the average for index constituents. The thinking being that above-average growth should command a higher multiple.
My criteria were quite demanding, and each stock had to meet all of them, so we ended up with a short list as a result. Of course, we could loosen the rules and create a longer list.
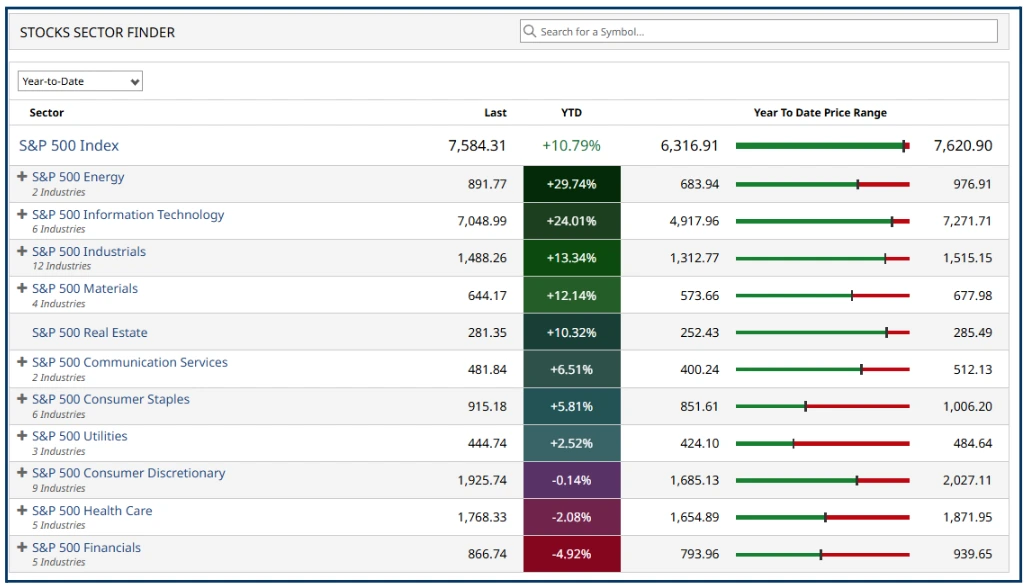
You may have noticed that there are 5 names from the energy sector in that list: APA, FANG, EQT, VNOM, COP, which suggests that though energy stocks have been the best performers YTD, there might be more than can be wrung out of certain names within the sector.
S&P 500 Sector performance year to date.
Source:Barchart.com
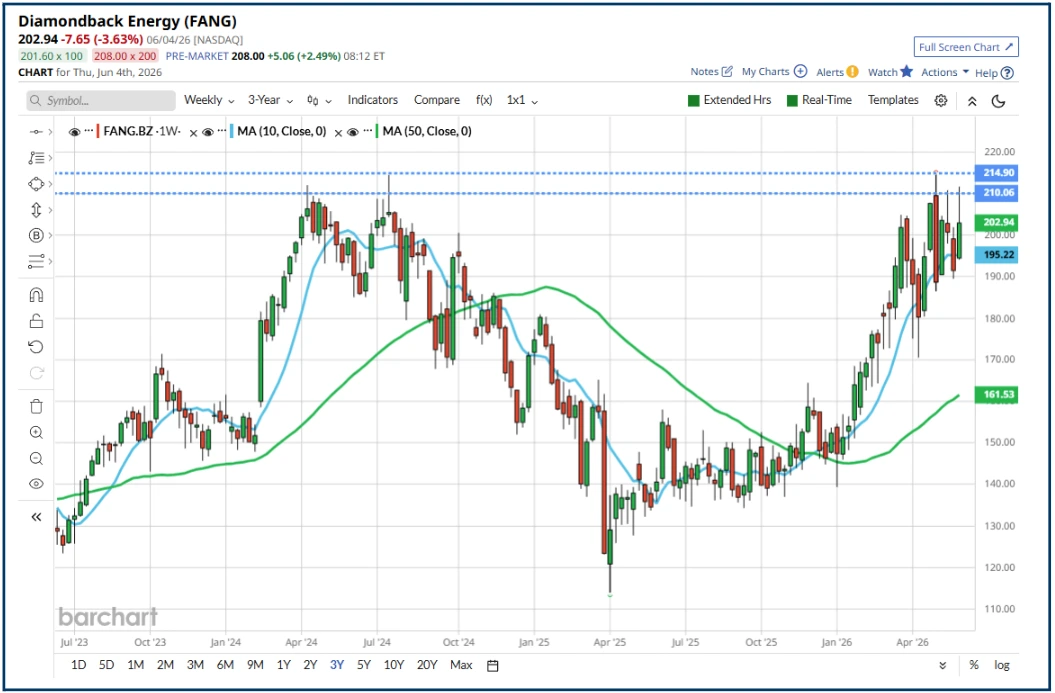
For example, what might lie in store for Diamondback Energy FANG if it moves above the resistance around $214.50? This is uncharted territory in the stock market.
Source:Barchart.com
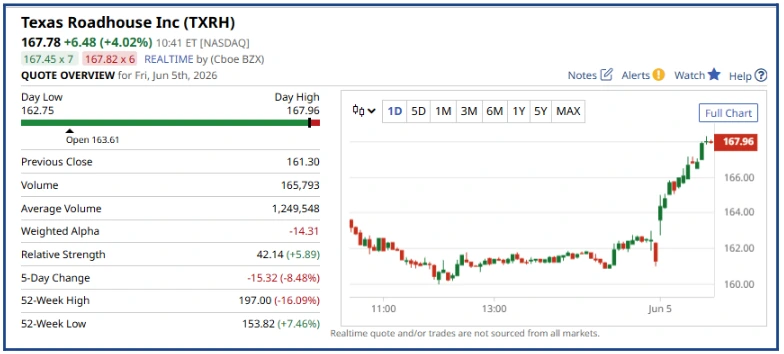
I am writing this on Friday afternoon, London time, having run the screens in the morning, and as I type, TXRH, the bottom stock from the shortlist of Russell 1000 constituents, is trading up by almost 4.25% at $167.96 at the same time, the S&P 500 index is down by almost -1.0%, which suggests that this strategy has legs.
Source:Barchart.com
The table of year-to-date performance highlights another area of potential opportunity. in the shape of the Financial sector, which at the time of writing was down -4.92% in 2026.
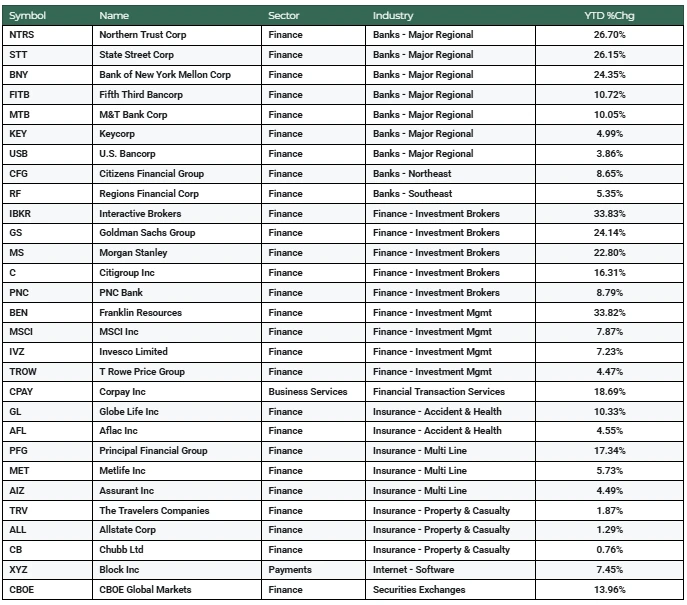
If we dig a bit deeper into the sector, however, we find it's far from an even playing field.
Top-performing stocks within the S&P 500 Financials sector
Source:Barchart.com/Darren Sinden
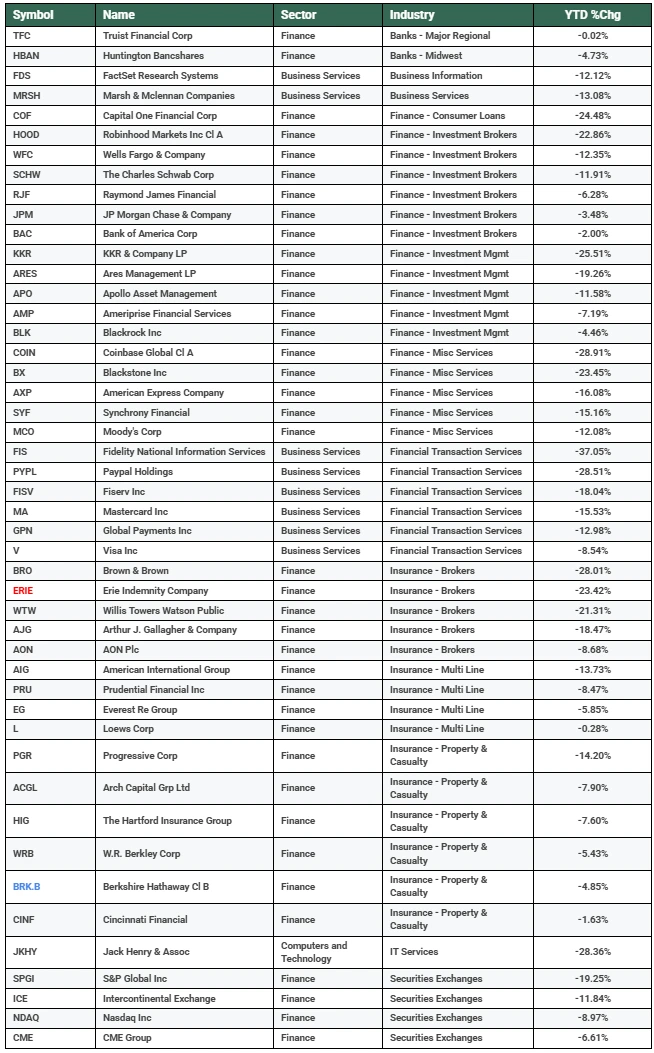
Bottom-performing stocks in the S&P 500 Financials sector
Source:Barchart.com/Darren Sinden
There are no obvious patterns based on the sub-sector and industry classification of the stocks above, and there are stocks from industries such as Investment management and Investment brokers in both tables.
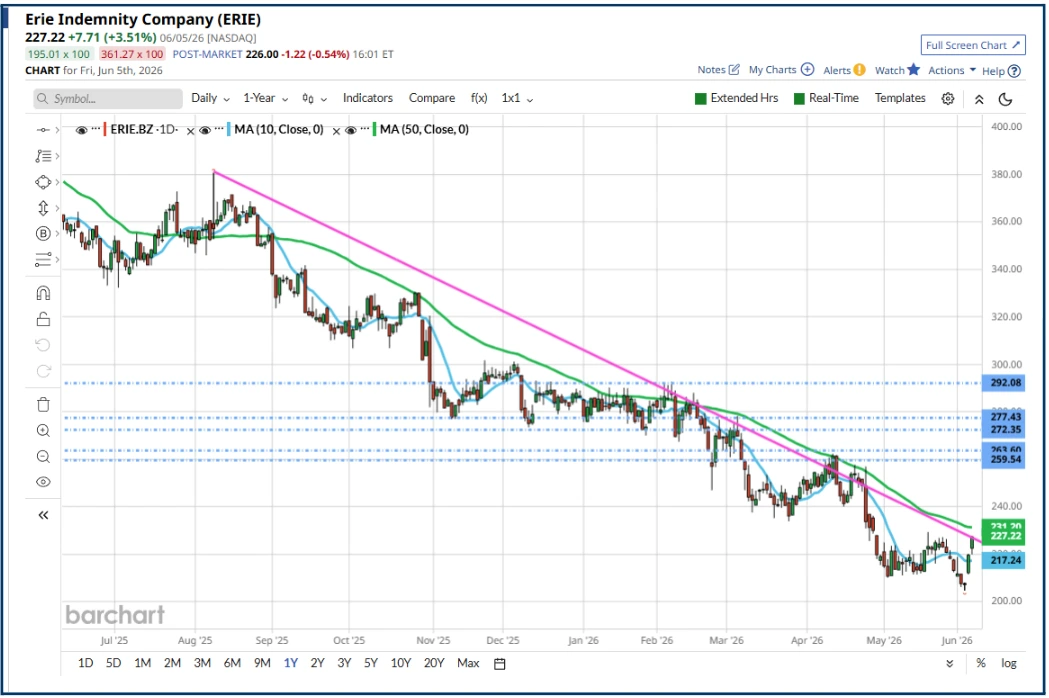
My eye is taken by the Insurance sector and by Erie Indemnity ERIE US, the company was promoted to the S&P in September 2024, the share price rallied from $372.68 in late July to peak at $547.00 2-months later.
Source:Barchart.com/Darren Sinden
Since then, however, it has been drifting lower, but there are now signs oSf life.
We have seen two bullish candles in the last two sessions, and the price has tested back at the long-term downtrend line shown in magenta above. There are no guarantees with a stock like this, but the fact that it rallied, and did so on a day when technology markets sold off, says to me that it's worth watching from here.
And while we're on the subject of underperforming insurance stocks, did you notice that Berkshire Hathaway BRK.B are also in the bottom table?
Warren Buffett may have retired, but the firm has an enviable track record and is sitting on around $400 billion in cash. It has a history of deploying cash at turning points in the market, usually to its advantage. So that’s another one I will be keeping an eye on.
The information provided does not constitute investment research. The material has not been prepared in accordance with the legal requirements designed to promote the independence of investment research and as such is to be considered to be a marketing communication.
All information has been prepared by ActivTrades (“AT”). The information does not contain a record of AT’s prices, or an offer of or solicitation for a transaction in any financial instrument. No representation or warranty is given as to the accuracy or completeness of this information.
Any material provided does not have regard to the specific investment objective and financial situation of any person who may receive it. Past performance is not a reliable indicator of future performance. AT provides an execution-only service. Consequently, any person acting on the information provided does so at their own risk. Forecasts are not guarantees. Rates may change. Political risk is unpredictable. Central bank actions may vary. Platforms’ tools do not guarantee success.