What did well when Tech was crashing?
The last month has been a tough time for tech investors and traders; a wholesale shift in the narrative that had been driving the markets for at least 18 months saw even the largest tech giants fall from grace, and where traders were once certain of a bright future for the AI and data centre trades, they were now anxious and unsure, as if the ground was moving beneath their feet.
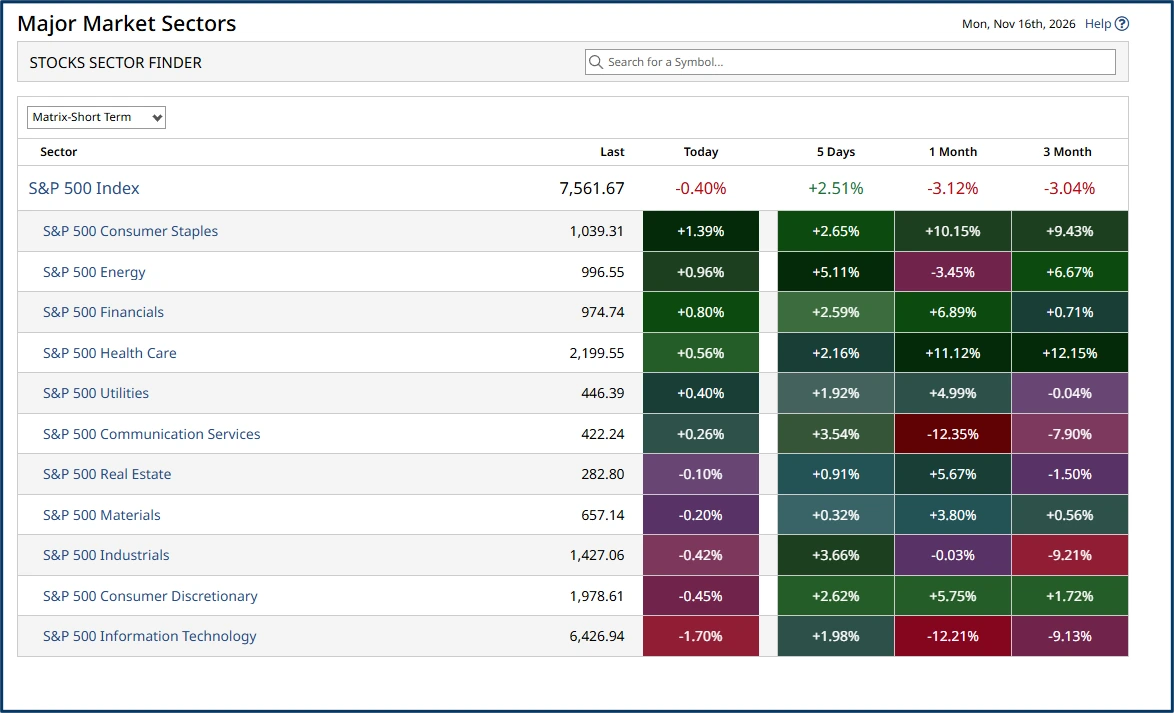
The table below captures the short-term performance of US (S&P 500 ) sector indices, and it highlights exactly what I am talking about; look down to the bottom row, and you will see that Information Technology has lost more than -12.0% in a month, and there is no guarantee that we have hit the bottom yet.
However, whilst tech was struggling, other stocks and sectors had their moment in the sun. When the market becomes fixated on one sector, and he price moves in it are often much larger than seen in other areas. It's easy to forget that there are 9 or 10 other sectors, and hundreds of stocks that aren't directly linked to AI and which have attractions all of their own.
S&P Sectors
Source: Barchart.com
Good to be boring
The most obvious beneficiary of the trouble in the Tech sector has been Consumer Staples, which contains stocks that make or sell the things we need to buy to live our daily lives.
Stocks that are seen as being boring and uninteresting. But sometimes that's not a bad combination, and the last month has certainly been one of those times.
One stock within the Consumer Staples sector is a perfect example of where the market has been looking to put its money whilst the Tech narrative burns, and that stock is Costco Wholesale COST US.
A warehouse-style discount retailer that is only open to members who pay an annual fee.
Costco recently declared a $30.0 per share special dividend and authorised a $4.0 bln share buyback that will run until November 2030.
The stock has also been attracting bullish broker comments, with, for example, JP Morgan raising its price target on the name by $135.00 in recent weeks.
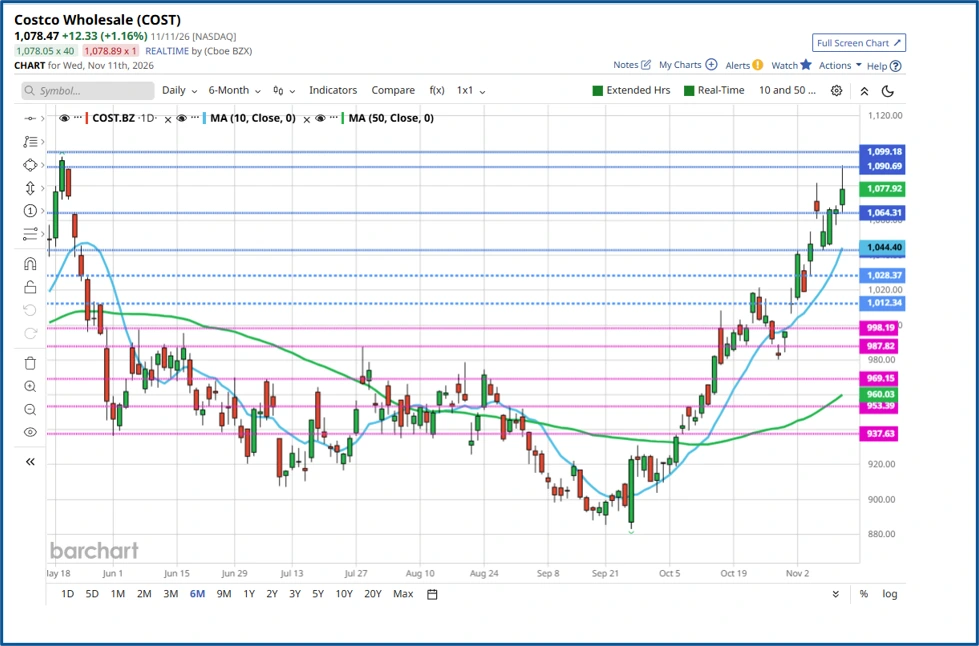
The chart (below) speaks for itself.
A bold green (bullish) candle on September 25th set the move in motion, and that was confirmed by the Moving average crossover on October 9th, with the faster-moving 10-day line moving up and through the slower-moving 50-day line.
The 10-day line provided support for the ensuing uptrend, and although it was briefly broken on October 28th, Costco posted a hammer candle the following day, which tells us that buyers were back in control at that point; the stock gapped higher thereafter and has continued to climb in price.
Source: Barchart.com
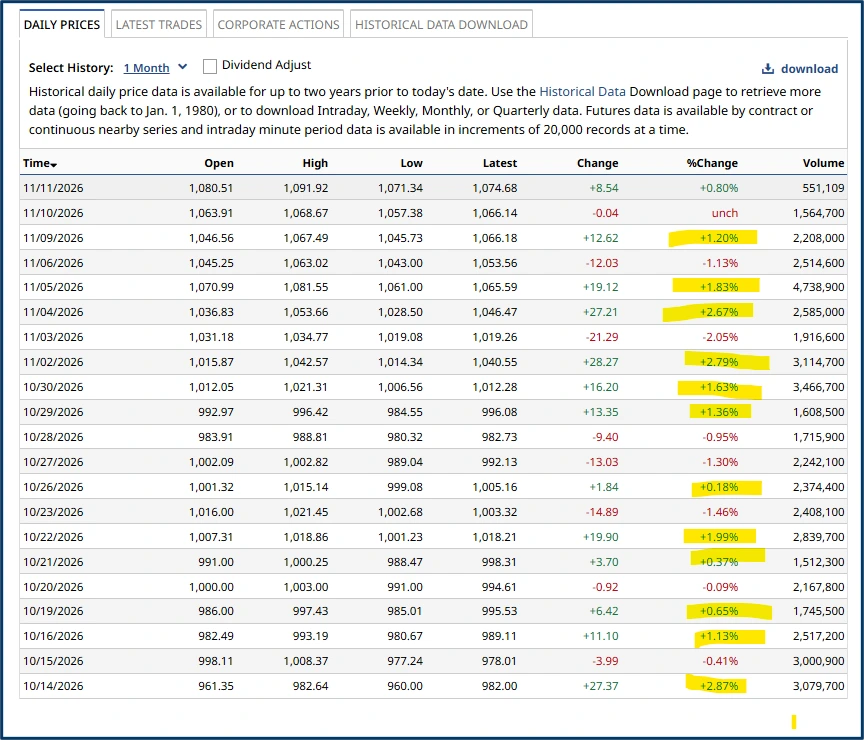
The table below captures the price action over the month to November 11th, and as you can see, there were far more ups than downs (more green than red) over that time frame.
COST HLOC data
Source: Barchart.com
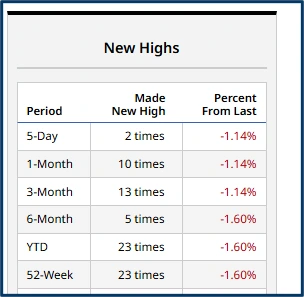
And there were plenty of new highs within these prints too.
COST New Highs
Source: Barchart.com
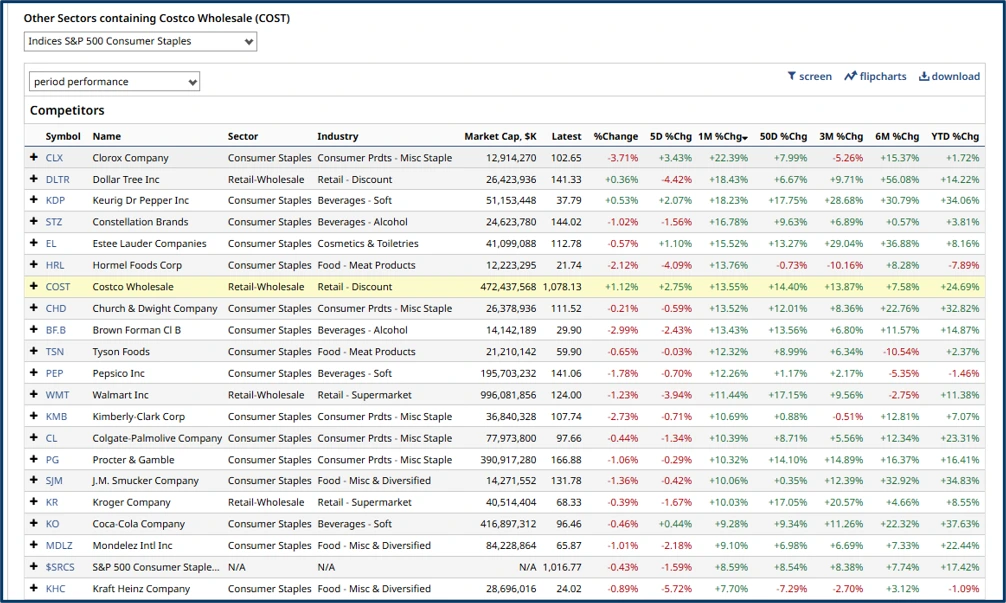
Costco was not the best performer among the Consumer Staples in the last month, though it did outperform the sector index (as you can see in this table), with Costco's +13.55% gain far exceeding the sector's 1-month gain of +8.50%.
S&P 500 Consumer Staples sector
Source: Barchart.com
Other Factors
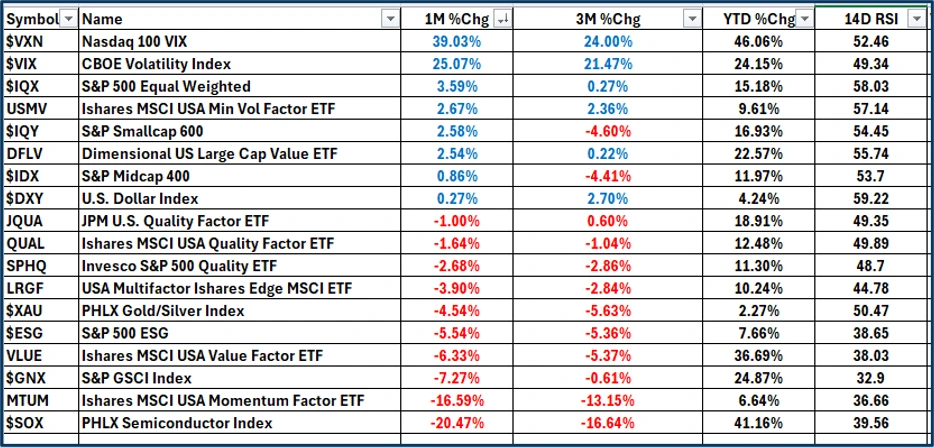
I have also created a table to look at so-called factor performance; factors can be thought of as investment styles or traits of particular stocks/groups of stocks, and I have added some measures of risk and defensive safe havens.
What stands out straight away is that volatility shot up over the last month. Volatility measures the tendency for stocks to experience outsized price moves, normally on the downside. Added to that, the Equal Weight S&P 500 index, which treats the tech giants and other heavyweights the same as other stocks, rallied by almost +3.60%, which might not sound exciting until you realise that the market cap-weighted version of the index lost some -3.12% over that month.
Gold is often seen as a safe place to park your money in turbulent times, yet the PHLX gold / Silver index fell by - 4.54%, and the Goldman Sachs Commodity Index (GSCI) fell by -7.27% as the dollar index strengthened. Money often flows into the dollar and dollar-denominated assets such as US Treasuries in volatile markets.
As of 11/11/2026 (close 10/11/2026)
Source: Barchart.com
What to take away
The takeaway from all this is to never become fixated on a single sector or section of the equity markets - crowded trades can look attractive when prices are rising, and greed is in the driver's seat, but when everybody heads for the exit at once, things can get very ugly very quickly. But even as that happens, there are still trading opportunities to be found.
As ever, you just need to know where to look and what to look for, but with a stock like Costco, you didn't have to look too far or too hard for the clues.
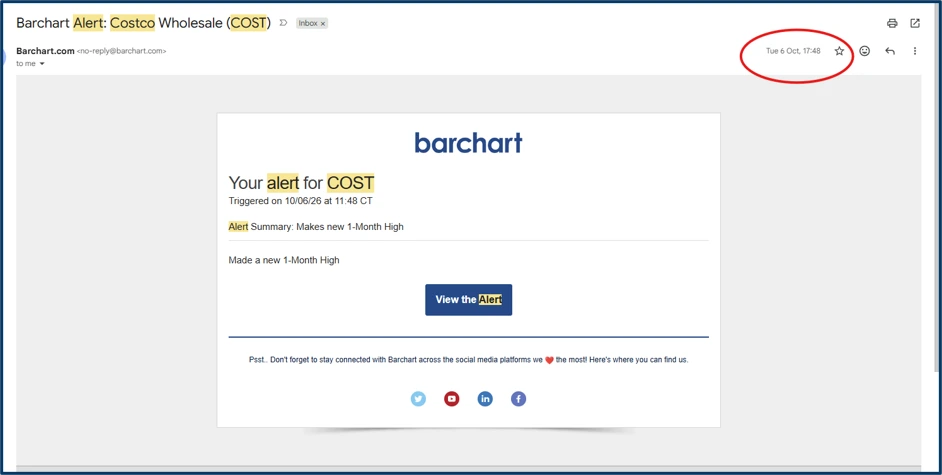
Clues like this email alert about a new one-month high in COST from Tuesday, October 6th.
Source: Barchart.com
The information provided does not constitute investment research. The material has not been prepared in accordance with the legal requirements designed to promote the independence of investment research and as such is to be considered to be a marketing communication.
All information has been prepared by ActivTrades (“AT”). The information does not contain a record of AT’s prices, or an offer of or solicitation for a transaction in any financial instrument. No representation or warranty is given as to the accuracy or completeness of this information.
Any material provided does not have regard to the specific investment objective and financial situation of any person who may receive it. Past performance is not a reliable indicator of future performance. AT provides an execution-only service. Consequently, any person acting on the information provided does so at their own risk. Forecasts are not guarantees. Rates may change. Political risk is unpredictable. Central bank actions may vary. Platforms’ tools do not guarantee success.